BINDの統計情報をデータを可視化するために前回に引き続きTimelion, Timeseriesを使用する。グラフの作り方も前回と変わらない。
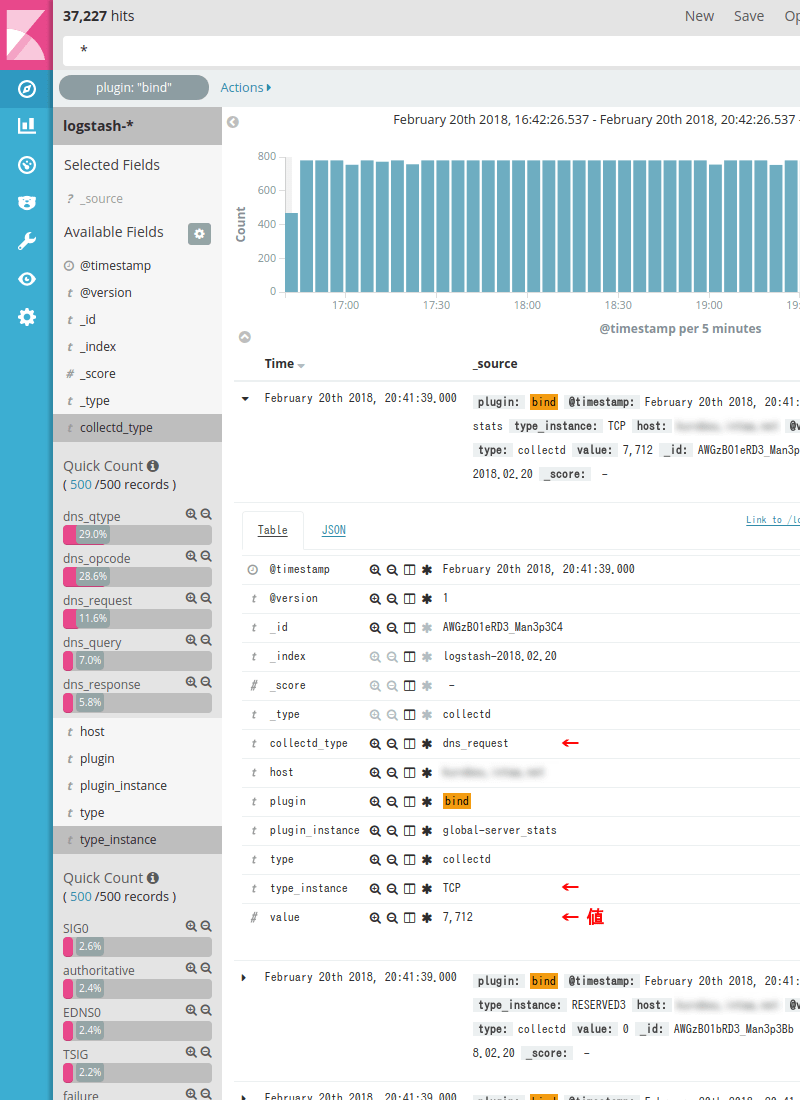
収集したBINDの統計情報のデータの形はこんなの。ホスト名、collectd_typeで絞って、type_instanceで分ければ良さそうに見える。
(上の画像のグラフは差分にしていない)
この統計情報も各値はBIND起動からの総量なので、数値は増加するのみ。BINDを再起動するなどで0に戻る。一定時間前の値との差分を表示するとその時間で増えた値を見ることができるのでTimelion, Timeseriesを使うことにする。
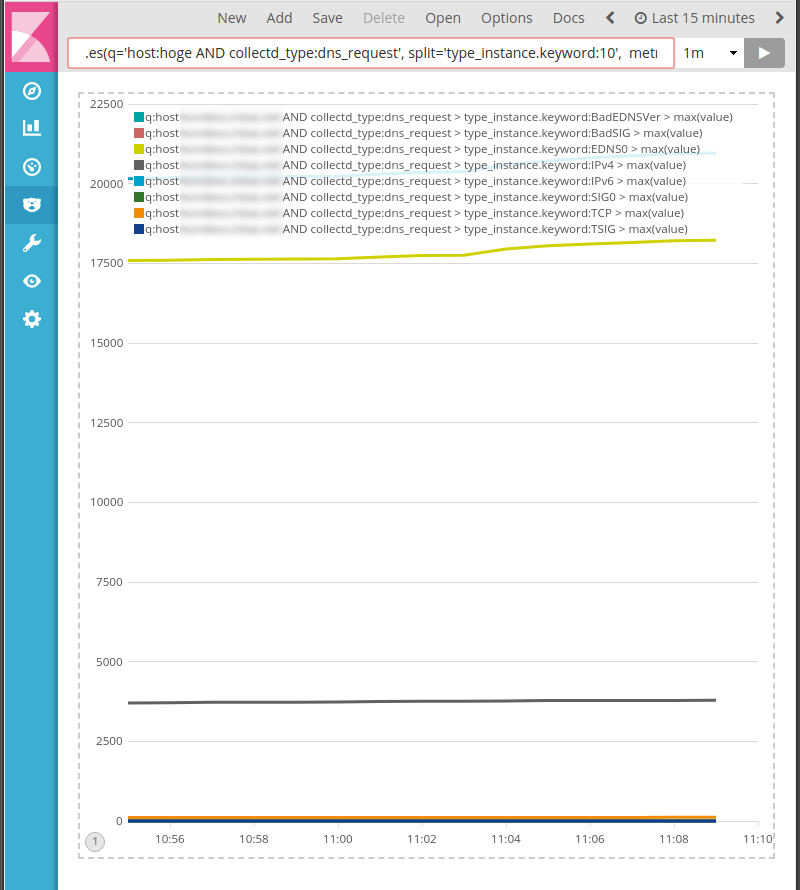
1 .es(q='host:hoge AND collectd_type:dns_request', split='type_instance.keyword:10', metric='max:value')
type_instanceで分けるのでsplit=hogeを使用する。splitを使う際は幾つまで分けるかを指定してやらないとエラーになるのでそこだけ注意。(上の例では :10 で10個)
で、1分間の差分を取るなら .es(hoge).subtract(.es(hoge, offset='-1m'))のように書くのを前回やった。
でも、splitを使っているとsubtract()がエラーになるのでsplitは諦めて1グラフずつ差分を作って並べることにする。(kibana6.2以降はできるような話を見たような気がするけど本当かしら?)
1 2 3 4 5 6 7 8 | .es(q='host:hoge AND collectd_type:dns_request AND type_instance:IPv6', metric='max:value').subtract(.es(q='host:hoge AND collectd_type:dns_request AND type_instance:IPv6', metric='max:value', offset='-1m')).label('IPv6').bars(width=3),
.es(q='host:hoge AND collectd_type:dns_request AND type_instance:IPv4', metric='max:value').subtract(.es(q='host:hoge AND collectd_type:dns_request AND type_instance:IPv4', metric='max:value', offset='-1m')).label('IPv4').bars(width=3),
.es(q='host:hoge AND collectd_type:dns_request AND type_instance:TCP', metric='max:value').subtract(.es(q='host:hoge AND collectd_type:dns_request AND type_instance:TCP', metric='max:value', offset='-1m')).label('TCP').bars(width=3),
.es(q='host:hoge AND collectd_type:dns_request AND type_instance:SIG0', metric='max:value').subtract(.es(q='host:hoge AND collectd_type:dns_request AND type_instance:SIG0', metric='max:value', offset='-1m')).label('SIG0').bars(width=3),
.es(q='host:hoge AND collectd_type:dns_request AND type_instance:TSIG', metric='max:value').subtract(.es(q='host:hoge AND collectd_type:dns_request AND type_instance:TSIG', metric='max:value', offset='-1m')).label('TSIG').bars(width=3),
.es(q='host:hoge AND collectd_type:dns_request AND type_instance:EDNS0', metric='max:value').subtract(.es(q='host:hoge AND collectd_type:dns_request AND type_instance:EDNS0', metric='max:value', offset='-1m')).label('EDNS0').bars(width=3),
.es(q='host:hoge AND collectd_type:dns_request AND type_instance:BadEDNSVer', metric='max:value').subtract(.es(q='host:hoge AND collectd_type:dns_request AND type_instance:BadEDNSVer', metric='max:value', offset='-1m')).label('BadEDNSVer').bars(width=3),
.es(q='host:hoge AND collectd_type:dns_request AND type_instance:BadSIG', metric='max:value').subtract(.es(q='host:hoge AND collectd_type:dns_request AND type_instance:BadSIG', metric='max:value', offset='-1m')).label('BadSIG').bars(width=3).title('DNS Request').yaxis(min=0)
|
1 2 3 4 5 | .es(q='host:hoge AND collectd_type:dns_response AND type_instance:SIG0', metric='max:value').subtract(.es(q='host:hoge AND collectd_type:dns_response AND type_instance:SIG0', metric='max:value', offset='-1m')).label('SIG0').bars(width=3),
.es(q='host:hoge AND collectd_type:dns_response AND type_instance:EDNS0', metric='max:value').subtract(.es(q='host:hoge AND collectd_type:dns_response AND type_instance:EDNS0', metric='max:value', offset='-1m')).label('EDNS0').bars(width=3),
.es(q='host:hoge AND collectd_type:dns_response AND type_instance:TSIG', metric='max:value').subtract(.es(q='host:hoge AND collectd_type:dns_response AND type_instance:TSIG', metric='max:value', offset='-1m')).label('TSIG').bars(width=3),
.es(q='host:hoge AND collectd_type:dns_response AND type_instance:normal', metric='max:value').subtract(.es(q='host:hoge AND collectd_type:dns_response AND type_instance:normal', metric='max:value', offset='-1m')).label('normal').bars(width=3),
.es(q='host:hoge AND collectd_type:dns_response AND type_instance:truncated', metric='max:value').subtract(.es(q='host:hoge AND collectd_type:dns_response AND type_instance:truncated', metric='max:value', offset='-1m')).label('truncated').bars(width=3).yaxis(min=0).title('DNS Response')
|
1 2 3 4 5 6 7 8 9 10 11 12 13 14 15 16 17 18 19 20 | .es(q='host:hoge AND collectd_type:dns_qtype AND type_instance:AAAA', metric='max:value').subtract(.es(q='host:hoge AND collectd_type:dns_qtype AND type_instance:AAAA', metric='max:value', offset='-1m')).label('AAAA').bars(width=3),
.es(q='host:hoge AND collectd_type:dns_qtype AND type_instance:A', metric='max:value').subtract(.es(q='host:hoge AND collectd_type:dns_qtype AND type_instance:A', metric='max:value', offset='-1m')).label('A').bars(width=3),
.es(q='host:hoge AND collectd_type:dns_qtype AND type_instance:TXT', metric='max:value').subtract(.es(q='host:hoge AND collectd_type:dns_qtype AND type_instance:TXT', metric='max:value', offset='-1m')).label('TXT').bars(width=3),
.es(q='host:hoge AND collectd_type:dns_qtype AND type_instance:CNAME', metric='max:value').subtract(.es(q='host:hoge AND collectd_type:dns_qtype AND type_instance:CNAME', metric='max:value', offset='-1m')).label('CNAME').bars(width=3),
.es(q='host:hoge AND collectd_type:dns_qtype AND type_instance:SOA', metric='max:value').subtract(.es(q='host:hoge AND collectd_type:dns_qtype AND type_instance:SOA', metric='max:value', offset='-1m')).label('SOA').bars(width=3),
.es(q='host:hoge AND collectd_type:dns_qtype AND type_instance:NS', metric='max:value').subtract(.es(q='host:hoge AND collectd_type:dns_qtype AND type_instance:NS', metric='max:value', offset='-1m')).label('NS').bars(width=3),
.es(q='host:hoge AND collectd_type:dns_qtype AND type_instance:DNSKEY', metric='max:value').subtract(.es(q='host:hoge AND collectd_type:dns_qtype AND type_instance:DNSKEY', metric='max:value', offset='-1m')).label('DNSKEY').bars(width=3),
.es(q='host:hoge AND collectd_type:dns_qtype AND type_instance:RRSIG', metric='max:value').subtract(.es(q='host:hoge AND collectd_type:dns_qtype AND type_instance:RRSIG', metric='max:value', offset='-1m')).label('RRSIG').bars(width=3),
.es(q='host:hoge AND collectd_type:dns_qtype AND type_instance:NAPTR', metric='max:value').subtract(.es(q='host:hoge AND collectd_type:dns_qtype AND type_instance:NAPTR', metric='max:value', offset='-1m')).label('NAPTR').bars(width=3),
.es(q='host:hoge AND collectd_type:dns_qtype AND type_instance:PTR', metric='max:value').subtract(.es(q='host:hoge AND collectd_type:dns_qtype AND type_instance:PTR', metric='max:value', offset='-1m')).label('PTR').bars(width=3),
.es(q='host:hoge AND collectd_type:dns_qtype AND type_instance:SSHFP', metric='max:value').subtract(.es(q='host:hoge AND collectd_type:dns_qtype AND type_instance:SSHFP', metric='max:value', offset='-1m')).label('SSHFP').bars(width=3),
.es(q='host:hoge AND collectd_type:dns_qtype AND type_instance:A6', metric='max:value').subtract(.es(q='host:hoge AND collectd_type:dns_qtype AND type_instance:A6', metric='max:value', offset='-1m')).label('A6').bars(width=3),
.es(q='host:hoge AND collectd_type:dns_qtype AND type_instance:ANY', metric='max:value').subtract(.es(q='host:hoge AND collectd_type:dns_qtype AND type_instance:ANY', metric='max:value', offset='-1m')).label('ANY').bars(width=3),
.es(q='host:hoge AND collectd_type:dns_qtype AND type_instance:SRV', metric='max:value').subtract(.es(q='host:hoge AND collectd_type:dns_qtype AND type_instance:SRV', metric='max:value', offset='-1m')).label('SRV').bars(width=3),
.es(q='host:hoge AND collectd_type:dns_qtype AND type_instance:Others', metric='max:value').subtract(.es(q='host:hoge AND collectd_type:dns_qtype AND type_instance:Others', metric='max:value', offset='-1m')).label('Others').bars(width=3),
.es(q='host:hoge AND collectd_type:dns_qtype AND type_instance:SPF', metric='max:value').subtract(.es(q='host:hoge AND collectd_type:dns_qtype AND type_instance:SPF', metric='max:value', offset='-1m')).label('SPF').bars(width=3),
.es(q='host:hoge AND collectd_type:dns_qtype AND type_instance:MX', metric='max:value').subtract(.es(q='host:hoge AND collectd_type:dns_qtype AND type_instance:MX', metric='max:value', offset='-1m')).label('MX').bars(width=3),
.es(q='host:hoge AND collectd_type:dns_qtype AND type_instance:LOC', metric='max:value').subtract(.es(q='host:hoge AND collectd_type:dns_qtype AND type_instance:LOC', metric='max:value', offset='-1m')).label('LOC').bars(width=3),
.es(q='host:hoge AND collectd_type:dns_qtype AND type_instance:TLSA', metric='max:value').subtract(.es(q='host:hoge AND collectd_type:dns_qtype AND type_instance:TLSA', metric='max:value', offset='-1m')).label('TLSA').bars(width=3),
.es(q='host:hoge AND collectd_type:dns_qtype AND type_instance:AXFR', metric='max:value').subtract(.es(q='host:hoge AND collectd_type:dns_qtype AND type_instance:AXFR', metric='max:value', offset='-1m')).label('AXFR').bars(width=3).yaxis(min=0).title('DNS QType')
|
この記事用としてdns_requestとdns_responsesとdns_qtypeの3つだけ例として挙げる。splitが効けば楽だったんだけど、使えないのでとにかく並べた。足りないのがあったらゴメンなさい。(たぶん足りない)
また、BIND再起動時を含むグラフが差分のマイナスのせいで見られたものではなくなるのを防ぐために最後に .yaxis(min=0) を付けてマイナス値を表示させないようにした。(チャート全体のタイトルも付けている)
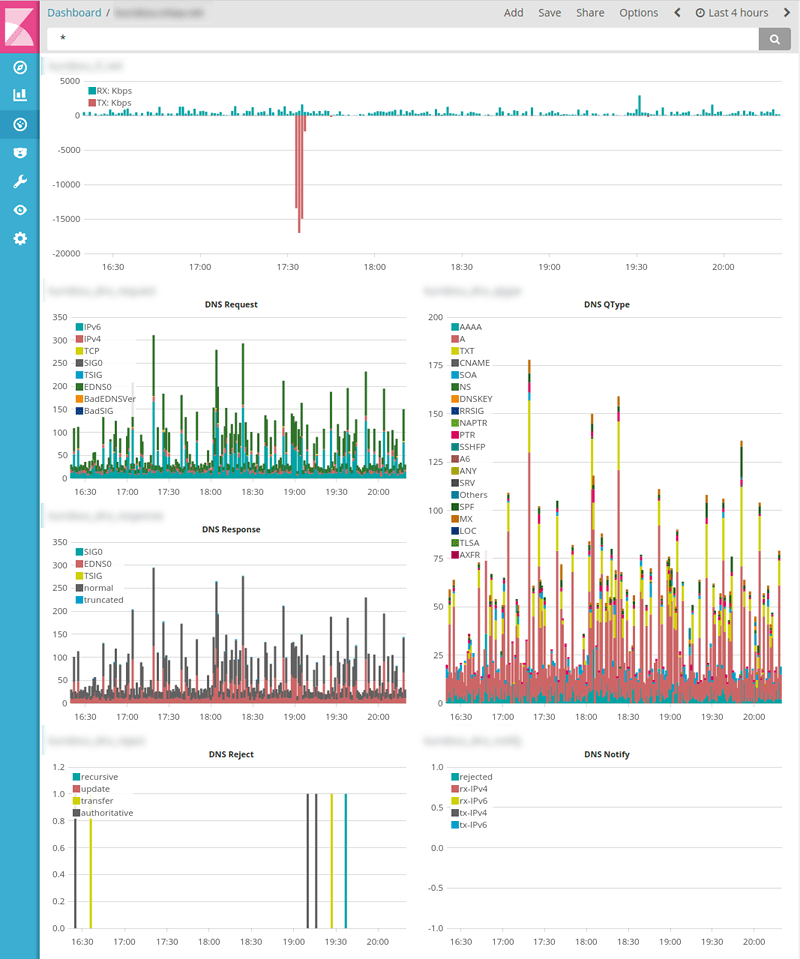
一番上のグラフは前回やったネットワークインターフェースの送受信。その下5つ(の内3つ)がこの記事のBIND関係のグラフ。
- ウェブ管理者の気まぐれ自作アクセス解析 ElasticsearchとKibanaを添えて
- TelegrafでElasticsearchにメトリクス送信+Kibanaで可視化 (後編)
- TelegrafでElasticsearchにメトリクス送信+Kibanaで可視化 (中編)
- TelegrafでElasticsearchにメトリクス送信+Kibanaで可視化 (前編)
- Metricbeatで収集したメトリクスデータをKibanaで可視化する
- Kibanaを操作する前にユーザーを作成する
- Metricbeat 8.6.0のインストールと設定
- Elastic Stack 8系をFreeBSDにインストール
- Elastic Stack 6.4.2への更新 FreeBSD ports用メモ
- WinlogbeatでWindowsイベントログを可視化 後編
- WinlogbeatでWindowsイベントログを可視化 中編
- WinlogbeatでWindowsイベントログを可視化 前編
- Elastic Stackを6.3.2に更新する
- Elastic Stackでシステム監視 Heartbeatで収集した死活情報をKibanaで可視化
- Elastic Stackでシステム監視 Heartbeatを使う準備
- Elastic Stackでシステム監視 FreeBSDのportsで6.2.3に更新
- ELK Stackでシステム監視 Filebeatで収集したVolumioのログから時系列の再生曲名リストを表示
- ELK Stackでシステム監視 Rspamd 1.7系のElasticsearchモジュールを試す
- ELK Stackでシステム監視 FilebeatでNTP統計ログ取得 Logstashで加工
- ELK Stackでシステム監視 FilebeatでRaspberry Pi Zero WのVolumio楽曲再生ランキング
- ELK Stackでシステム監視 MeticbeatでRaspberry Pi Zero WのVolumioを監視
- ELK Stackでシステム監視 FilebeatでFreeBSDのCPU温度取得+Kibanaグラフ化
- ELK Stackでシステム監視 FilebeatでFail2banのBan情報+地図表示
- ELK Stackでシステム監視 MetricbeatでNginxのステータス情報を取得+グラフ化
- ELK Stackでシステム監視 FreeBSDのportsでELK Stack6系をインストール
- ELK Stackでシステム監視 FreeBSDにMetricbeatをインストールしてみる
- ELK Stackでシステム監視 elasticsearchインデックスのスキーマが勝手に変わる対処 テンプレート作成
- NanoPi NEO2(arm64)用にFilebeatをビルド
- ELK Stackでシステム監視 kibanaでDNSサーバの情報表示
- ELK Stackでシステム監視 kibanaのTimelion,Timeseriesでグラフ作成