この前のMetricbeatのインストール記事にも書いたけど、どうにもMetricbeatのモジュールとMetricSetの関係がわからない。公式サイトのドキュメントでは例えばNginxはモジュールでそのMetricSetはstubstatusとなっているし、Nginxモジュールを使って実際に出力したデータもそうなっている。だけど、デバッグ表示ではNginxモジュールというのは存在しなくて nginx/stubstatus というMetricSetだけが存在するということになっている。だからなのかモジュールの有効化・無効化がドキュメントどおりにできない。 MetricSetの方もたとえばSystemモジュールで利用可能な筈の system/uptime を使おうとするとレジストされてないので使えないと表示されるけどレジストってなんじゃらほい状態。system/uptimeはデバッグ表示で見ても表示されてないから使えないんだろうけど、elastic社の公式サイトのドキュメントではFreeBSDでも利用可能な表示になってるんだけどねぇ。
ちなみにportsでビルドして /usr/ports/sysutils/beats/work/beats-6.2.2/metricbeat/module/system/uptime を見るとそこにuptimeのソースはあるのでなんだかなぁ状態。
2018-03-12T09:36:11.884+0900 DEBUG [modules] beater/metricbeat.go:80 Register [ModuleFactory:[docker, mongodb, mysql, postgresql, system, uwsgi], MetricSetFactory:[aerospike/namespace, apache/status, ceph/cluster_disk, ceph/cluster_health, ceph/cluster_status, ceph/monitor_health, ceph/osd_df, ceph/osd_tree, ceph/pool_disk, couchbase/bucket, couchbase/cluster, couchbase/node, docker/container, docker/cpu, docker/diskio, docker/healthcheck, docker/image, docker/info, docker/memory, docker/network, dropwizard/collector, elasticsearch/node, elasticsearch/node_stats, etcd/leader, etcd/self, etcd/store, golang/expvar, golang/heap, graphite/server, haproxy/info, haproxy/stat, http/json, http/server, jolokia/jmx, kafka/consumergroup, kafka/partition, kibana/status, kubernetes/container, kubernetes/event, kubernetes/node, kubernetes/pod, kubernetes/state_container, kubernetes/state_deployment, kubernetes/state_node, kubernetes/state_pod, kubernetes/state_replicaset, kubernetes/system, kubernetes/volume, logstash/node, logstash/node_stats, memcached/stats, mongodb/collstats, mongodb/dbstats, mongodb/status, mysql/status, nginx/stubstatus, php_fpm/pool, postgresql/activity, postgresql/bgwriter, postgresql/database, prometheus/collector, prometheus/stats, rabbitmq/node, rabbitmq/queue, redis/info, redis/keyspace, system/core, system/cpu, system/diskio, system/filesystem, system/fsstat, system/load, system/memory, system/network, system/process, system/process_summary, system/raid, uwsgi/status, vsphere/datastore, vsphere/host, vsphere/virtualmachine, zookeeper/mntr]]
デバッグログ表示でモジュールとMetricSetのリストを見る。
ここから本題。今回はNginxのステータスをMetricbeatで取得する。基本的な仕組みはcollectdでNginxのステータスを取得するのと同じ。
Nginxでステータス表示
Nginxの設定 /usr/local/etc/nginx/nginx.conf1 2 3 4 5 | #前略
http {
#中略
include /usr/local/etc/nginx/vhosts/*.conf;
}
|
/usr/local/etc/nginx/vhostsにnginxのバーチャルホストの設定を置くとする。
そして/usr/local/etc/nginx/vhosts/にある*.conf設定ファイルをインクルードする設定を追加。
1 2 3 4 5 6 7 | server {
listen 127.0.0.1:80;
location /ngstat {
stub_status on;
access_log off;
}
}
|
Nginxのバーチャルホストの1つとして127.0.0.1:80で待ち受けるものを作成する。
その/ngstatにアクセスすることでNginxのステータスを取得する。
なので、Nginxのhttp_stub_statusモジュールが使える状態でないと当然動かない。
ローカルホスト専用なのでアクセス制限は考えなくてOK.
上の2つの設定は以前の記事そのまま。
# service nginx reload #←Nginx設定再読み込み # curl http://127.0.0.1/ngstat Active connections: 3 server accepts handled requests 2760 2760 2979 Reading: 0 Writing: 1 Waiting: 2
このように表示(もちろん数値は違う筈)されればNginx側は準備完了。
Metricbeatの設定
前のMetricbeatインストールの記事と大部分同じ設定であるとする。
/usr/local/etc/metricbeat.yml1 2 3 4 5 6 7 8 9 10 11 12 13 14 15 16 17 18 | metricbeat.config.modules:
path: ${path.config}/beats/metric_*.yml #ここが初期値と変わってるので注意
reload.enabled: false
#output.elasticsearch: #elasticsearchには出力しない
# hosts: ["localhost:9200"]
output.logstash:
hosts: ["localhost:5044"]
logging.level: debug #ログ出力をデバックレベルにする
logging.selectors: ["*"]
logging.to_syslog: false
logging.to_files: true #ログファイルを出力する
logging.files:
path: /var/log #ログファイルのPath
name: metricbeat.log #ログファイル名
↑ここは字下げする(2行)
|
ログファイル/var/log/metricbeat.logにデバックログを出力する設定にしたのが前回と違う点。
/usr/local/etc/beats/metric_nginx.yml (新規ファイル)1 2 3 4 5 6 | - module: nginx
metricsets: ["stubstatus"]
enabled: true
period: 60s #←1分間隔
hosts: ["http://127.0.0.1"]
server_status_path: "ngstat"
|
portsをビルドしたときのファイルが残っているなら /usr/ports/sysutils/beats/work/beats-6.2.2/metricbeat/modules.d に各種モジュールの設定ファイルの雛形があるのでそれをコピーする手もある。
その場合はファイル名を変更する。metricbeat.ymlで指定したインクルードするファイル名はmetric_*.ymlなのでそれに沿ったファイル名にする。(例: nginx.yml.disabled → metric_nginx.yml)
公式サイトの役に立ちそうであまりそうでもないMetricbeatのモジュール関係のドキュメントも参照。
確認
# service metricbeat restartMetricbeatを再起動する。 /var/log/metricbeat.log
1 2 3 4 5 6 7 8 9 10 11 12 13 14 15 16 17 18 19 20 21 22 23 24 25 26 27 28 29 30 31 32 33 | 2018-03-12T09:42:11.953+0900 DEBUG [publish] pipeline/processor.go:275 Publish event: {
"@timestamp": "2018-03-12T00:42:11.952Z",
"@metadata": {
"beat": "metricbeat",
"type": "doc",
"version": "6.2.2"
},
"metricset": {
"name": "stubstatus",
"module": "nginx",
"host": "127.0.0.1",
"rtt": 507
},
"nginx": {
"stubstatus": {
"requests": 2931,
"hostname": "127.0.0.1",
"reading": 0,
"handled": 2712,
"accepts": 2712,
"current": 1,
"waiting": 0,
"active": 1,
"writing": 1,
"dropped": 0
}
},
"beat": {
"version": "6.2.2",
"name": "hoge.localnet",
"hostname": "hoge.localnet"
}
}
|
ログを確認し、Nginxモジュールが出力したデータがあることを確認する。 上の出力例の8行目から13行目の部分を探すが、 hage:{hoge} は並び順が決まっておらず入れ替わりまくりなので上の出力例の順番に表示されるとは限らない。つまり8〜13行目にあるとは限らない。
Timelionでグラフにする
今回は抽出条件をhostで対象ホスト、metricset.moduleをnginxでNginxモジュールにする。値となるのはnginx.stubstatus.HOGEでHOGEの部分はrequests, reading, handled, accepts, current, waiting, active, writing, dropedとなる。
nginx.stubstatus.hostname は扱わない。この内、accepts, handled, requestsの3つは累積値なので例によって1分前の値との差を出す。その際に敢えて差分がマイナス値になるようにして下向けの折れ線グラフにする。
その他の値は累積値ではないので単純に折れ線グラフにする。
kibana6になって1分毎に取得した値を単純にグラフ化すると何故かそれが殆ど表示されなくなったので、.es(interval='1m', hoge)というようにインターバル指定を追加している。それが下。
1 2 3 4 5 6 7 8 9 | .es(interval='1m', q='host:hoge.localnet AND metricset.module:nginx' , metric='max:nginx.stubstatus.accepts', offset='-1m').subtract(.es(q='host:hoge.localnet AND metricset.module:nginx' , metric='max:nginx.stubstatus.accepts')).lines(width=1, fill=1).label('accepts: ↓'),
.es(interval='1m', q='host:hoge.localnet AND metricset.module:nginx' , metric='max:nginx.stubstatus.handled', offset='-1m').subtract(.es(q='host:hoge.localnet AND metricset.module:nginx' , metric='max:nginx.stubstatus.handled')).lines(width=1, fill=1).label('handled: ↓'),
.es(interval='1m', q='host:hoge.localnet AND metricset.module:nginx' , metric='max:nginx.stubstatus.requests', offset='-1m').subtract(.es(q='host:hoge.localnet AND metricset.module:nginx' , metric='max:nginx.stubstatus.requests')).lines(width=1, fill=1).label('requests: ↓'),
.es(interval='1m', q='host:hoge.localnet AND metricset.module:nginx' , metric='max:nginx.stubstatus.current').lines(width=1, fill=1).label('current: ↑'),
.es(interval='1m', q='host:hoge.localnet AND metricset.module:nginx' , metric='max:nginx.stubstatus.active').lines(width=1, fill=1).label('active: ↑'),
.es(interval='1m', q='host:hoge.localnet AND metricset.module:nginx' , metric='max:nginx.stubstatus.dropped').lines(width=1, fill=1).label('dropped: ↑'),
.es(interval='1m', q='host:hoge.localnet AND metricset.module:nginx' , metric='max:nginx.stubstatus.reading').lines(width=1, fill=1).label('reading: ↑'),
.es(interval='1m', q='host:hoge.localnet AND metricset.module:nginx' , metric='max:nginx.stubstatus.waiting').lines(width=1, fill=1).label('waiting: ↑'),
.es(interval='1m', q='host:hoge.localnet AND metricset.module:nginx' , metric='max:nginx.stubstatus.writing').lines(width=1, fill=1).label('writing: ↑')
|
最初の3行は差分、それ以外は単純な線グラフ。個別に書いて並べるので面倒だけど簡単ではある。
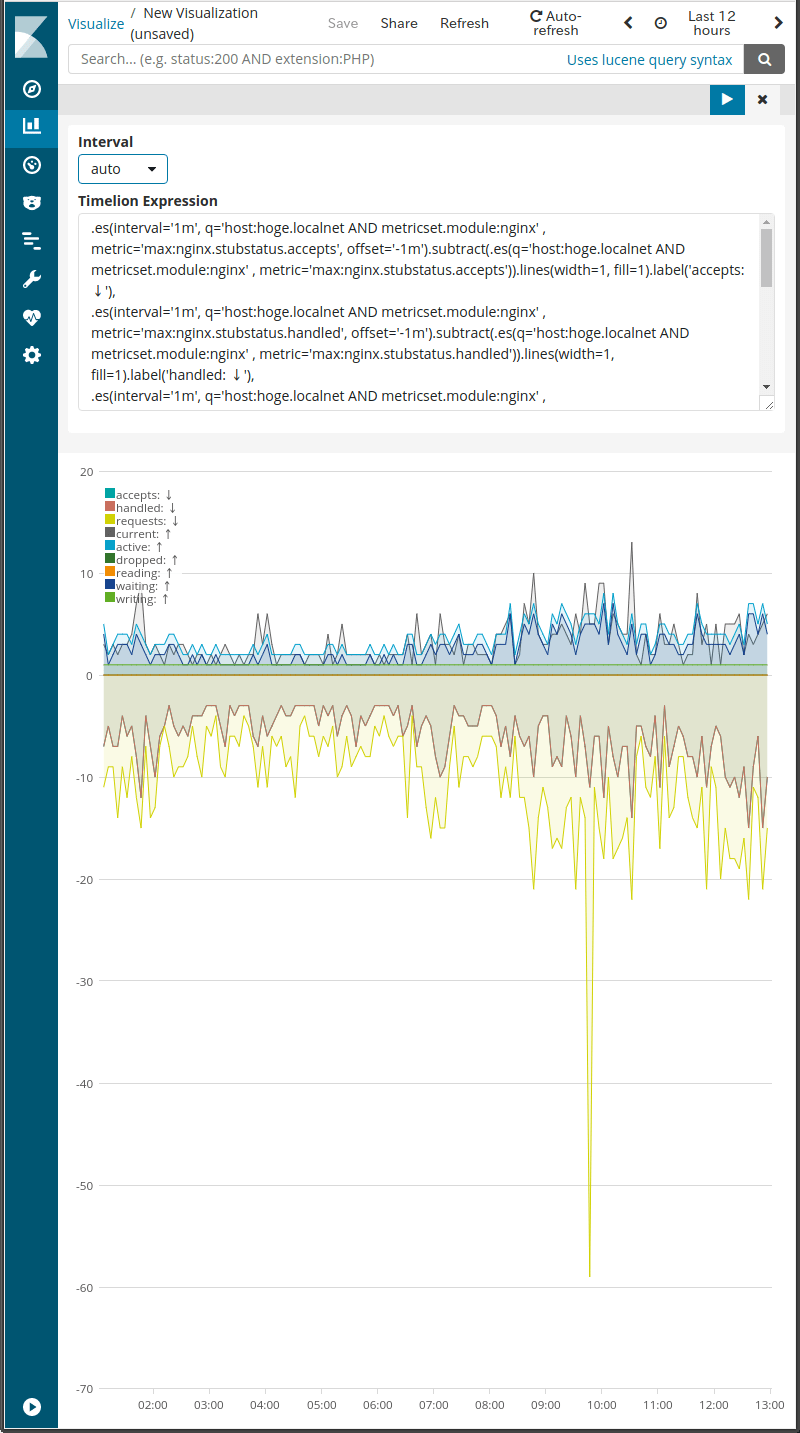
こんな感じ。
関連記事:- ウェブ管理者の気まぐれ自作アクセス解析 ElasticsearchとKibanaを添えて
- TelegrafでElasticsearchにメトリクス送信+Kibanaで可視化 (後編)
- TelegrafでElasticsearchにメトリクス送信+Kibanaで可視化 (中編)
- TelegrafでElasticsearchにメトリクス送信+Kibanaで可視化 (前編)
- Metricbeatで収集したメトリクスデータをKibanaで可視化する
- Kibanaを操作する前にユーザーを作成する
- Metricbeat 8.6.0のインストールと設定
- Elastic Stack 8系をFreeBSDにインストール
- Elastic Stack 6.4.2への更新 FreeBSD ports用メモ
- WinlogbeatでWindowsイベントログを可視化 後編
- WinlogbeatでWindowsイベントログを可視化 中編
- WinlogbeatでWindowsイベントログを可視化 前編
- Elastic Stackを6.3.2に更新する
- Elastic Stackでシステム監視 Heartbeatで収集した死活情報をKibanaで可視化
- Elastic Stackでシステム監視 Heartbeatを使う準備
- Elastic Stackでシステム監視 FreeBSDのportsで6.2.3に更新
- ELK Stackでシステム監視 Filebeatで収集したVolumioのログから時系列の再生曲名リストを表示
- ELK Stackでシステム監視 Rspamd 1.7系のElasticsearchモジュールを試す
- ELK Stackでシステム監視 FilebeatでNTP統計ログ取得 Logstashで加工
- ELK Stackでシステム監視 FilebeatでRaspberry Pi Zero WのVolumio楽曲再生ランキング
- ELK Stackでシステム監視 MeticbeatでRaspberry Pi Zero WのVolumioを監視
- ELK Stackでシステム監視 FilebeatでFreeBSDのCPU温度取得+Kibanaグラフ化
- ELK Stackでシステム監視 FilebeatでFail2banのBan情報+地図表示
- ELK Stackでシステム監視 MetricbeatでNginxのステータス情報を取得+グラフ化
- ELK Stackでシステム監視 FreeBSDのportsでELK Stack6系をインストール
- ELK Stackでシステム監視 FreeBSDにMetricbeatをインストールしてみる
- ELK Stackでシステム監視 elasticsearchインデックスのスキーマが勝手に変わる対処 テンプレート作成
- NanoPi NEO2(arm64)用にFilebeatをビルド
- ELK Stackでシステム監視 kibanaでDNSサーバの情報表示
- ELK Stackでシステム監視 kibanaのTimelion,Timeseriesでグラフ作成