Bluestar LinuxはArch LinuxベースでデスクトップがKDE Plasmaだけど、標準的なPlasmaデスクトップとは少し違って雰囲気だけ虫食い林檎系なOSのデスクトップなの。パッケージの管理システムはPacmanなのでArch Linuxに慣れているなら難しくはない。Pacmanをコマンドで操作するのが苦手な場合はGUIなOctopiもある。
提供されるイメージファイルは基本的にx86_64だけのよう。
例によってNetbookに毛の生えた程度の低スペックのノートPCにインストールしてみた。
インストール
インストールはイメージファイルをDVD-Rなどに焼いてライブモードで起動。ライブモードのデスクトップにインストール用のアイコンがあるのでそれを実行。インストールの言語は英語のままで触らない。日本語は表示できない。
キーボードのキーマップは日本語キーボードを使っているならJapaneseを選択。日本語キーボードのバリエーションは基本的に触らない。
パーティションの設定は「消す」を選択すれば既存のハードディスク/SSDの内容を全消しで適切にパーティションを作成してくれる。選択を求められる内容は少しで簡単なので迷ったり悩むところは無い筈。
追記: 特に有線LANで(DHCPなどのネットワークの自動設定が可能)の場合、インストール中にインターネットに自動的につながるとインストールの最後の方で自動更新が勝手に行われるが、これが数時間かかる場合がありいつまで経ってもインストールが終わらないというこになりかねないのでインストール前にLANケーブルを抜いておくのがオススメ。
起動後の設定
インストール後の起動はライブモードと変わらず、そして相変わらず日本語は全く表示できない。なにしろ日本語の表示できるフォントすら入ってない。
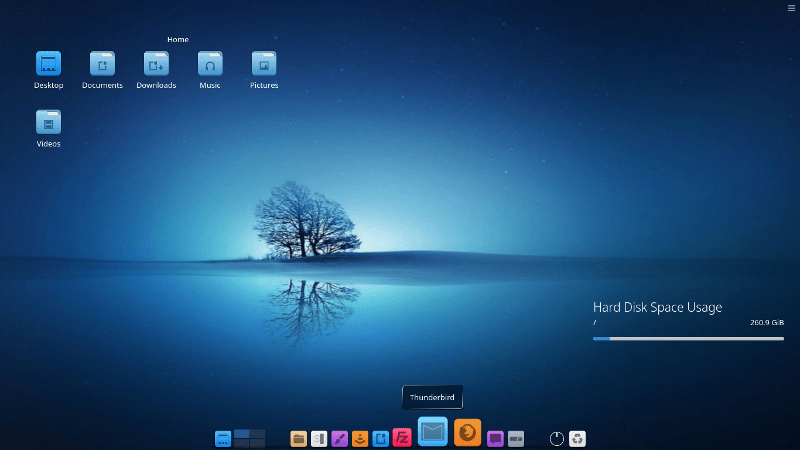
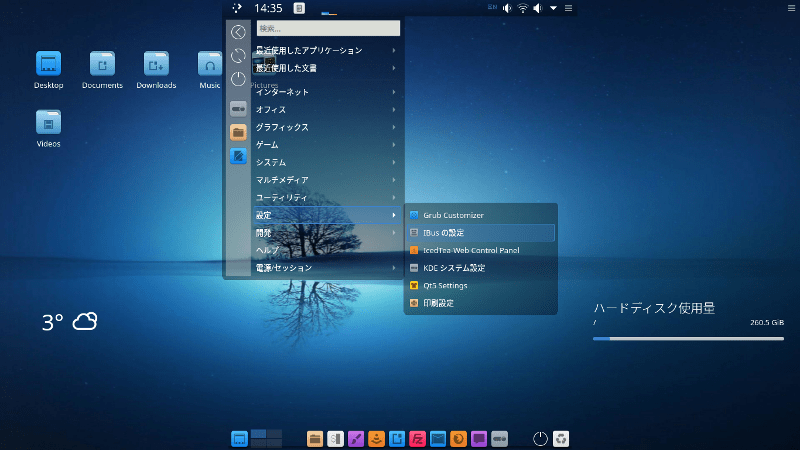
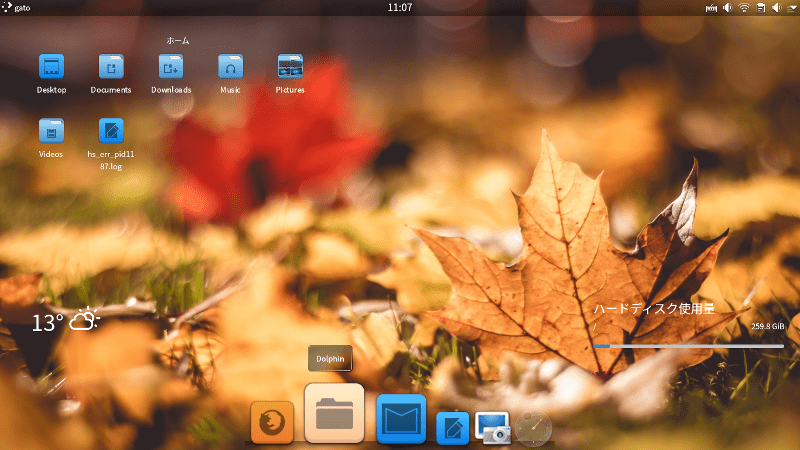
でも、すっきりオシャレ。
最下段中央のドックはマウスカーソルの通ったところのアイコンが大きくなる某アレみたいなの。ただし、標準のアイコンはイマドキ風な地味なデザインでその上にラベルが表示されないと何が何だかよくわからないやつ。
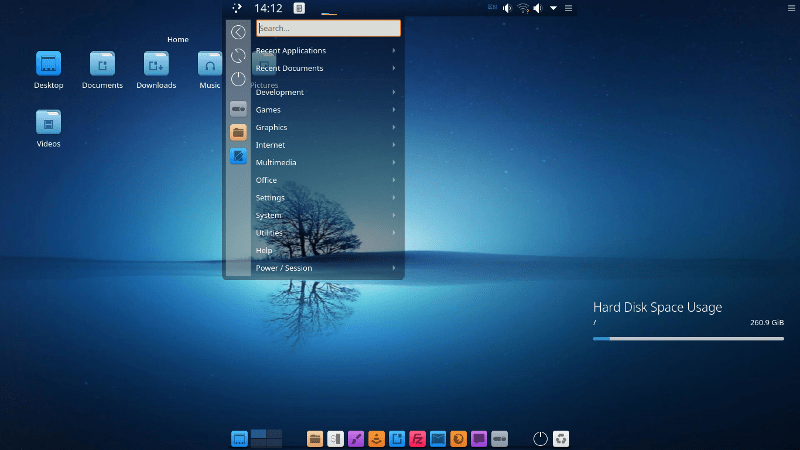
標準的なKDE Plasmaデスクトップのアプリケーションランチャー(Windowsのスタートボタン相当)はデスクトップの左下(または画面四隅のどれか)だけど、Bluestar Linuxの標準状態ではデスクップ中央の最上部に隠れているのをマウスカーソルでその辺りを触ってプルダウンで出現させるパネルの左端にある。ちょっと判りにくい。
また、アプリケーションランチャーの背景が半透明なのはオシャレかもしれないが、デスクトップの状態によってはとても見辛い。
有線LANでDHCPの場合は繋いだだけでネットワークにつながるかもしれない(未確認)が、無線LANの場合はBluestar Linuxでは設定ウィザードが開くどころか全く何もしてくれないので手動で設定しなければならない。
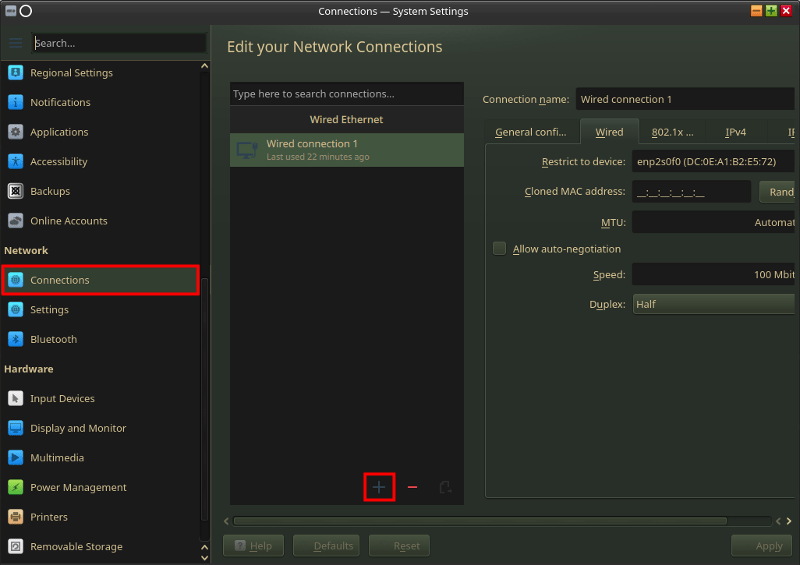
デスクトップ上部中央のアプリケーションランチャーからSettings→KDE System Settingsを開き(ドックにもある) 、左列からNetworkのConnectionsを選択する。中央列の下の方の[+]を押して無線LANの設定を追加する。[+]を押して追加というのさえできれば後は簡単。接続する無線LANのAPのSSIDが表示されている筈なのでそれを選ぶ程度。最後にApplyを押す。PSKの入力を求められたら入力する。(最初だけ、1度入力した筈なのに次回システム起動時にPSKを再度入力させられるかもしれない。)
これで、ようやくネットに接続できるので後は好き放題。
日本語環境の設定
Bluestar Linuxで日本語を使うためにやらなくてはならないのは以下5点。
- 日本語フォントのインストール
- 表示言語の選択
- iBusの削除 (任意)
- FcitxとMozcのインストール
- Fcitx & Mozcの設定
日本語フォントはパッケージでインストールしても良い。アプリケーションランチャーからSystem→Octopiを起動し、検索のテキストボックスにnoto-fonts-cjkやotf-ipafontなどを検索してリストに表示されたパッケージを右クリックしてインストール指定し、検索窓の左にあるでインストール。
しかし、個人的には好みのフォントだけ入れたい。
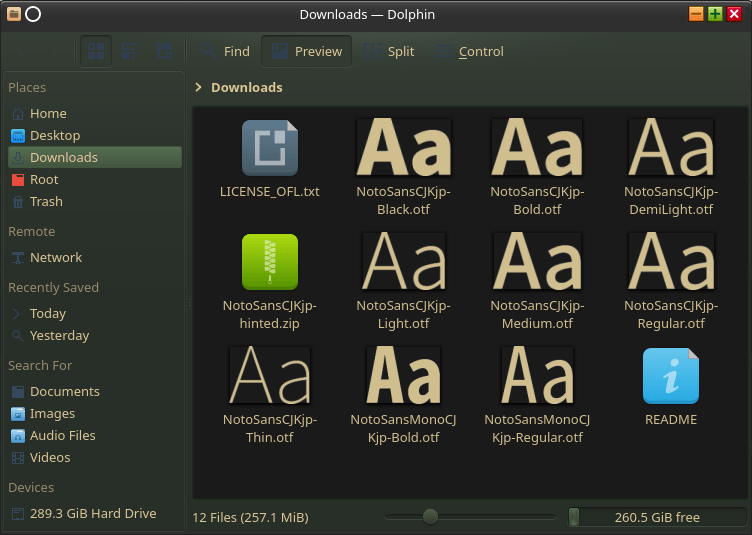
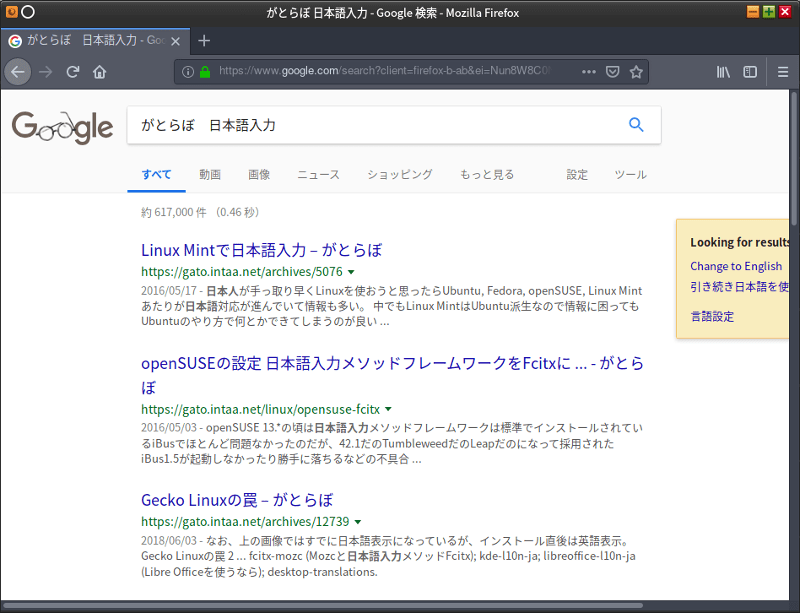
そこで、ブラウザを開いて好きなフォントをダウンロードする。(上の画像はNotoSansCJK-jpをダウンロードした)
フォントマネージャからインストールしても良いし、上の画像の状態でインストールしたいフォントをクリックして開いてインストールしても良い。(次)
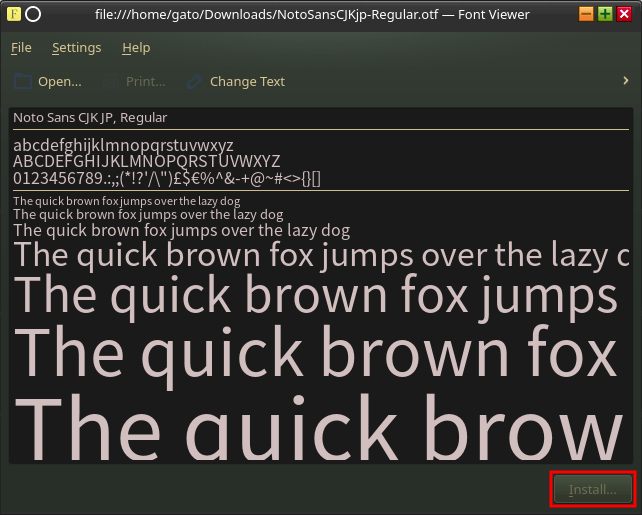
フォントファイルをクリックすると上の画像のようにフォントビューアが開く。表示されたフォントで問題なければ右下の[Install]を押す。これでインストールできる。インストール先としてユーザーかシステム全体を対象とするか尋ねられるのでシステム全体とすれば良いかと。
デスクトップ上部中央のアプリケーションランチャーからSettings→KDE System Settingsを開き(ドックにもある) 、
左列からRegional Settingsを選択。
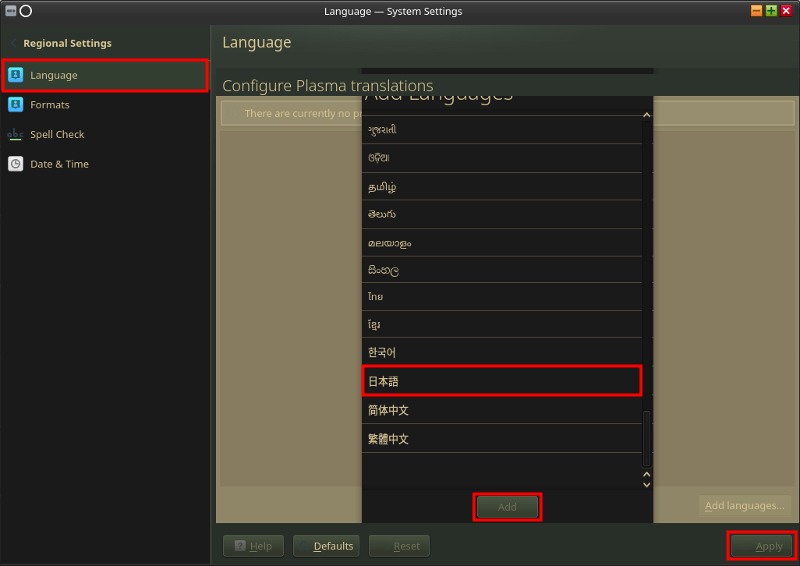
Regional Settingsの左列から[Language]を選択。右列の右下にある[Add Languages]ボタンを押す。
言語リストが表示されるので一番下にスクロールすると[日本語]があるのでそれを選択して[Add]を押して右下の[Apply]を押す。
再ログインするかシステムを再起動する。
システムが日本語表示されるようになった。
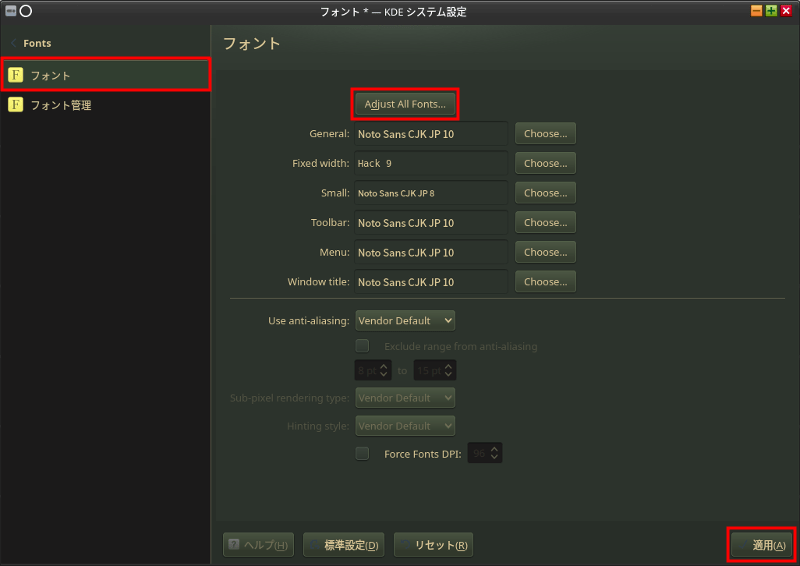
ただ、それだけでは少し怪しいのでKDEシステム設定から「Fonts」を開き、[Adjust All Font]ボタンを押してインストールした日本語フォントを指定する。変更するのはフォントだけがオススメ。(左上の「フォント」のチェックボックスにチェックしないと変更できない)
アプリケーションランチャーからシステム→Octopiを開く。
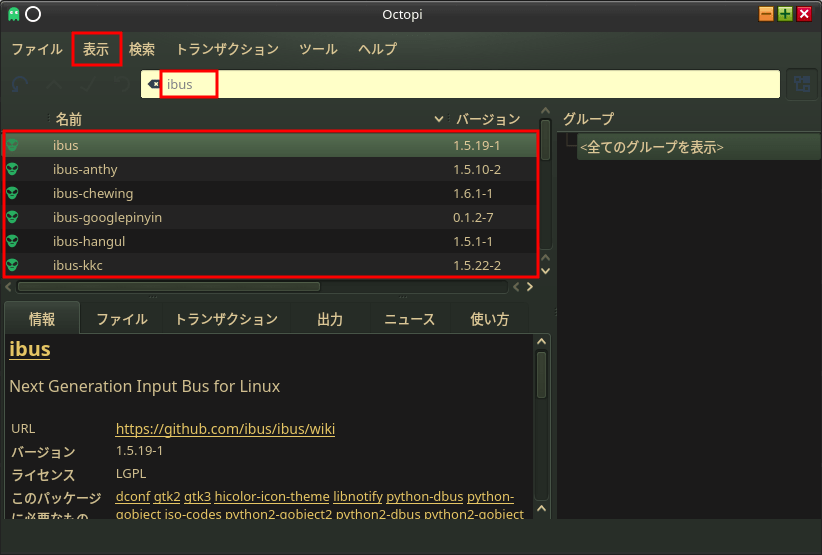
上部のメニューから[表示]→「インストール済み」を選択して、検索テキストボックスにibusを入力する。
iBus関係のインストール済みパッケージがリスト表示されるので全て右クリックして「削除」を押す。
このとき間違ってlibusb関係のパッケージを削除しないこと。また、libibusは他への影響が大きいので削除しない方が良さげ。
検索窓の左にあるでアンインストールする。
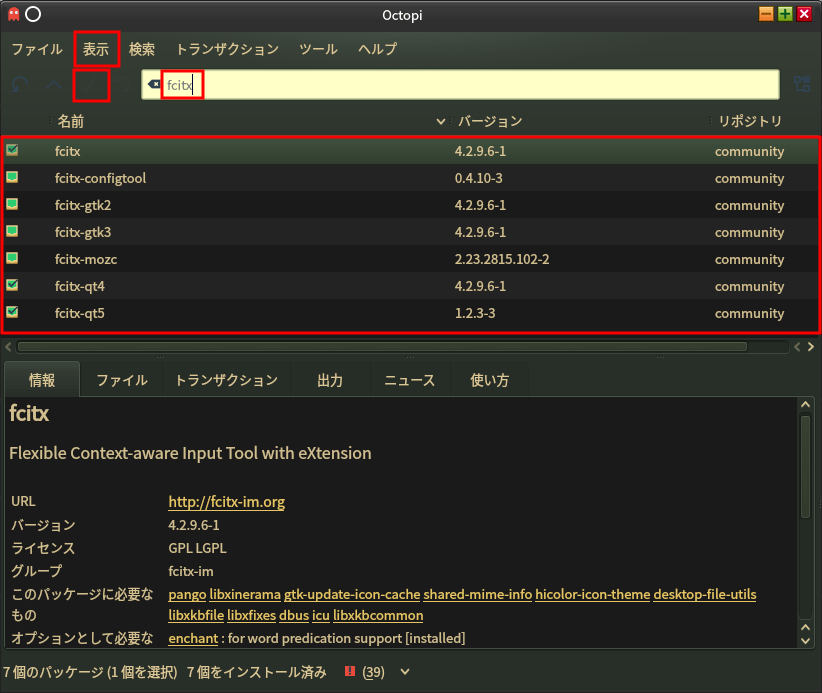
上部のメニューから[表示]→「未インストール」を選択して、検索テキストボックスにfcitxを入力する。
Fcitx関係のパッケージがリスト表示されるので fcitx, fcitx-configtool, fcitx-gtk2, fcitx-gtk3, fcitx-mozc, fcitx-qt4, fcitx-qt5 の7つのパッケージを右クリックしてインストール指定する。
検索窓の左にあるでインストールする。
デスクトップ最下段のドックにKonsoleがあるのでクリックしてコンソール画面を開く。 エディタで~/.xprofileを編集する。
$ nano .xprofile
または、
$ vim .xprofile
1 2 3 4 5 6 7 8 9 | #export GTK_IM_MODULE=ibus
#export XMODIFIERS=@im=ibus
#export QT_IM_MODULE=ibus
export GTK_IM_MODULE=fcitx
export XMODIFIERS=@im=fcitx
export QT_IM_MODULE=fcitx
#/usr/bin/ibus-daemon --xim --replace --daemonize
|
こんな感じ。上の例では元の内容をコメントにしてその下に新たに書いてるけど、もちろん元の内容のibusの部分をfcitxに書き換えるだけでもOK.編集したら保存してエディタを閉じる。
システムを再起動する。
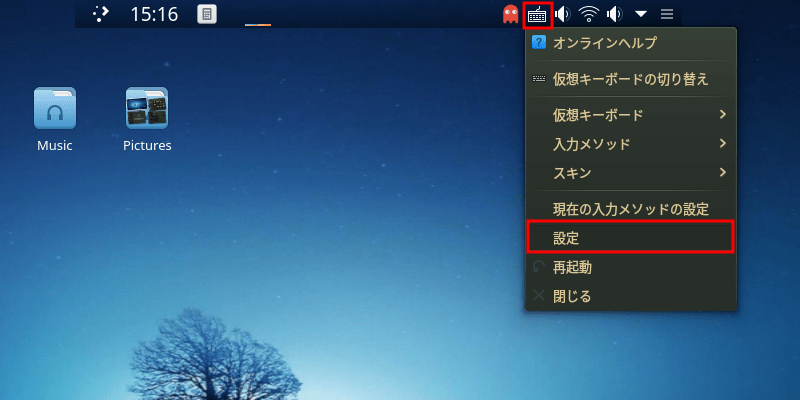
画面最上部中央からパネルをプルダウンさせて右寄りにあるキーボードのアイコンを右クリックする。
[設定]をクリックする。
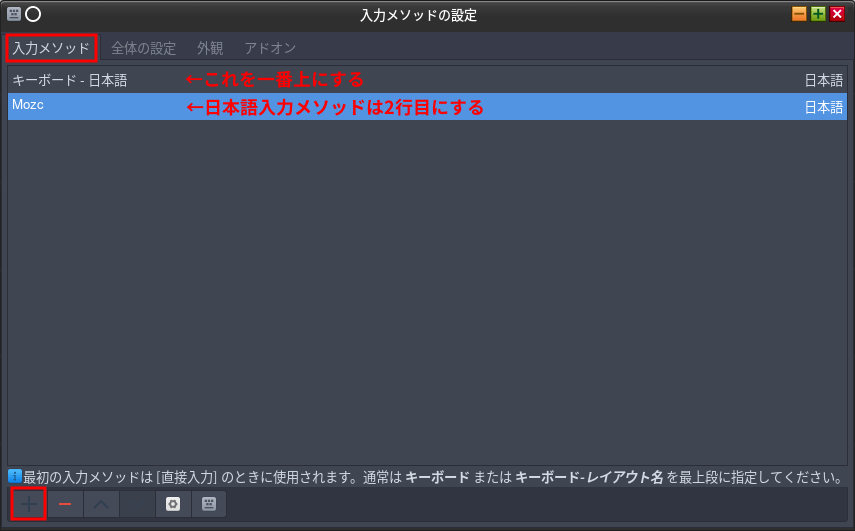
左上の[入力メソッド]タブを選択する。(最初からこれの筈)
左下の[+]を押してリストからMozcを選択する。
上の画像と同じになる筈。もしもMozcがリストの一番上になっていたら2番めにする。選択して最下部の[]と[]で調整する。
日本語入力メソッドFcitxでどのキーを押すと英数字日本語モードに切り替えるかの設定。
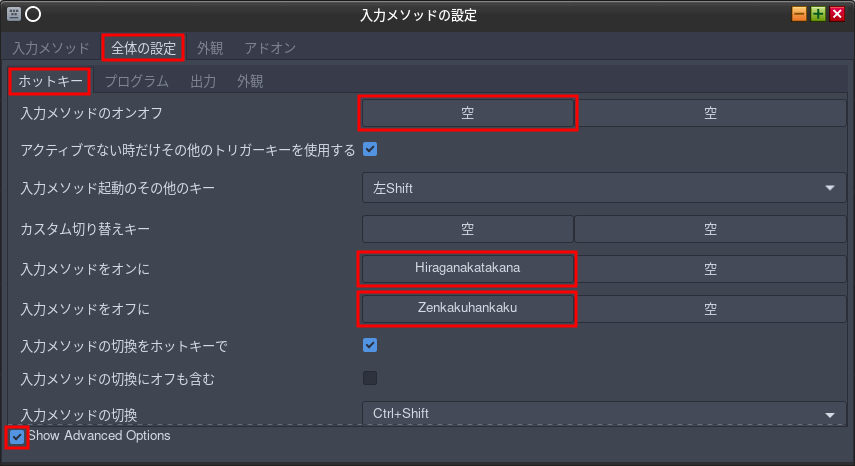
[全体の設定]タブを選択する。
その下の[ホットキー]タブを選択する。(最初からこれの筈)
基本的には入力「メソッドのオンオフ」で1つまたは2つキーを登録するとそのキーで日本語モードのオンオフが切り替えられるようになる。つまり同じキーでオンとオフがトグル。
個人的にはそれだとモードを間違えて嫌なので「メソッドのオンオフ」は「空」にする。(クリックして[Esc]を押す)
左下のShow Advanced Optionsにチェックする。
「入力メソッドをオンに」「入力メソッドをオフに」が出現するのでそれぞれ[ひらがな/カタカナ]、[全角/半角]キーを登録する。これで日本語モードにするのは[ひらがな/カタカナ]、英数字モードにするのは[全角/半角]という使い分けなった。これは好みの問題なのでマネしてねとは書かない。
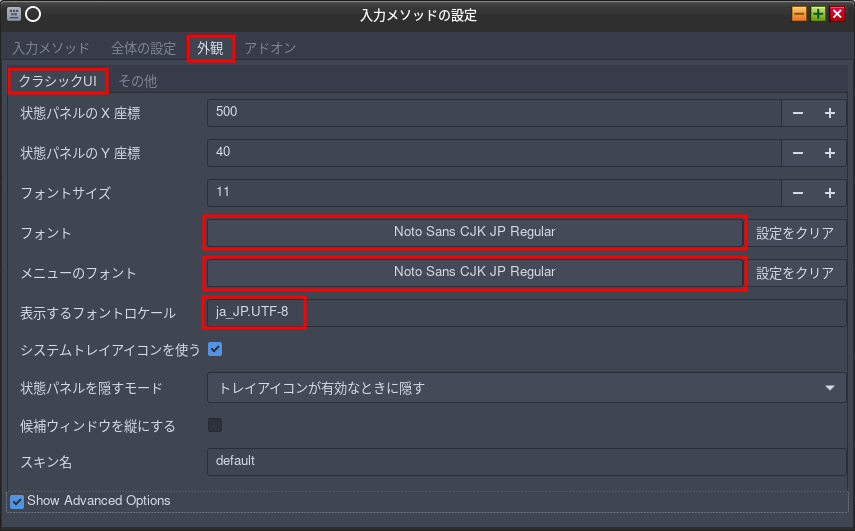
どうでも良いけど表示するフォントを変えておく。
[外観]タブを選択する。
その下の[クラシックUI]タブを選択する。
「フォント」と「メニューのフォント」の2つをインストールした日本語フォントする。
フォントロケールを ja_JP.UTF-8 にする。
日本語を入力できるようになった。
日本語変換Mozcの設定は省略。
ところで、ネットワークに接続した後あたりからデスクトップの左下の方に天気のマークと温度が表示されるようになった筈。ただのウィジェットなので削除(右クリックしてRemove)して良いんだけど、せっかくなので活用したい。ところでかなり低い気温が表示されてるけど一体どこなのかしら?ドイツのボンっぼい。
そんな地球の裏側の温度を表示されても困るので、日本を指定することにする。
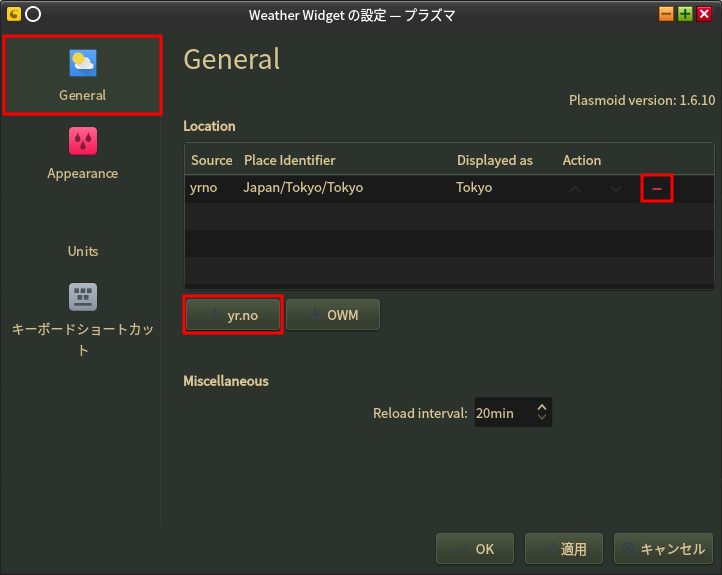
デスクトップの天気表示部分を右クリックして[Config Weather Widget]を選択。
左列はGeneralを選択。(最初からこれの筈)
右列のリストに表示されてるのが要らない(上の画像は東京になってるけど)ので一番右の[−]をクリックして削除する。
リストの下の[+yr.no]ボタンを押す。
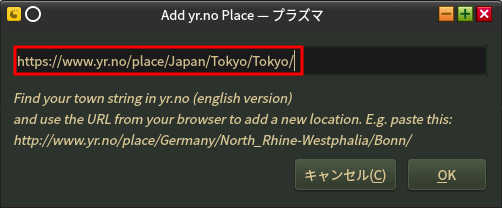
東京は https://www.yr.no/place/Japan/Tokyo/Tokyo/
大阪は https://www.yr.no/place/Japan/Osaka/Osaka/
名古屋は https://www.yr.no/place/Japan/Aichi/Nagoya/
北海道は https://www.yr.no/place/Japan/Hokkaido/Sapporo/
福岡は https://www.yr.no/place/Japan/Fukuoka/Fukuoka/
https://www.yr.no/で表示したい都市名を検索するとURLを得られる。
URLを入力して右下の[OK]で1つ前の画面に戻るので最下部の[適用]ボタンを押す。
Bluestar Linuxで採用されているドックは綺麗で定評のあるlatte-dock。
ドックを右クリックしてLayoutsを選択してExtendedを選択、
または、ドックを右クリックしてDock/Panel Settingsを選択、上部のタブでAppearanceを選択して、右上のAdvancedスイッチをオンにするとレイアウト選択が可能になるのでレイアウトのプルダウンメニューからExtendedを選択した。
それが上の画面。
ドックが一回り大きくてデスクトップ最上部に常設のアプリケーションメニューバーのパネルが表示されるので一昔前のアレっぽさが増す。背景画像は別途切り替えている。
Bluestar Linuxに限らず最近のKDE Plasmaデスクトップ共通だと思うけど、システムの再起動・シャットダウン・ログオフが標準で2段になっている。例えば、電源オフにしようと思って電源断のアイコンをクリックするともう一度システムの再起動・シャットダウン・ログオフの選択肢が出てくる。個人的にはこれはケシカラン挙動だと思うので、KDEシステム設定から「起動と終了」を開き、左列から「デスクトップセッション」を選択して、右列の全般の項目で、ログアウトを確認するのチェックを外す(非初期値)、シャットダウンオプションを提供するにチェックする(初期値)。ただし、Bluestar Linuxではこれをやるとドックの電源オフのアイコンが電源断専用になるので、間違って押してしまうと問答無用でシャットダウンするので危険。つまりドックの電源オフのアイコンを削除してデスクトップ上部のアプリケーションランチャーから電源オフ・再起動・ログオフする人向けね。
自宅PCなどで他に触る人がいないからということで自動ログインにするなら別だけど、持ち運ぶノートPCなどはログイン認証必須かと思うが、Bluestar Linuxは標準のログイン画面が20年前のようなガッカリなやつなのでKDEシステム設定から「起動と終了」を開き、左列からLoginScreen(SDDM)を選択して、右列のテーマリストからBreezeあたりを選択するとイマドキなログイン画面になる。オススメとは断言しない。
速度的には遅すぎてダメというほど酷くはない。気になるのは大きいアプリの起動で待たされるのと、システム起動後にログインしてからデスクトップが表示されるまでが長いところ。それ以外は超非力なノートPCでも意外と不満を感じない。
LinuxはArch系が良いけど面倒なのはイヤだし、できたらオシャレなのが良いという支離滅裂なワガママさんにオススメできるディストリビューション。最初に日本語が全く表示できないところで面食らうが、Arch Linuxの常識が通じるし日本語フォントさえ入れてしまえば後は簡単、むしろ素人でも使える優しい部類。個人的には結構気に入った。